BI reporting has become an indispensable part of any company. In business intelligence, companies sometimes have to choose between tools such as PowerBI, QlikSense, Tableau, MikroStrategy, Looker or DataStudio (and others). Even though each of these tools has its own strengths and weaknesses, good reporting depends less on the respective tool, but much more on the analyst and his or her skills in structured and appropriate visualisation and text design.
5 tips for better reporting and data visualisation in your business intelligence and data analysis
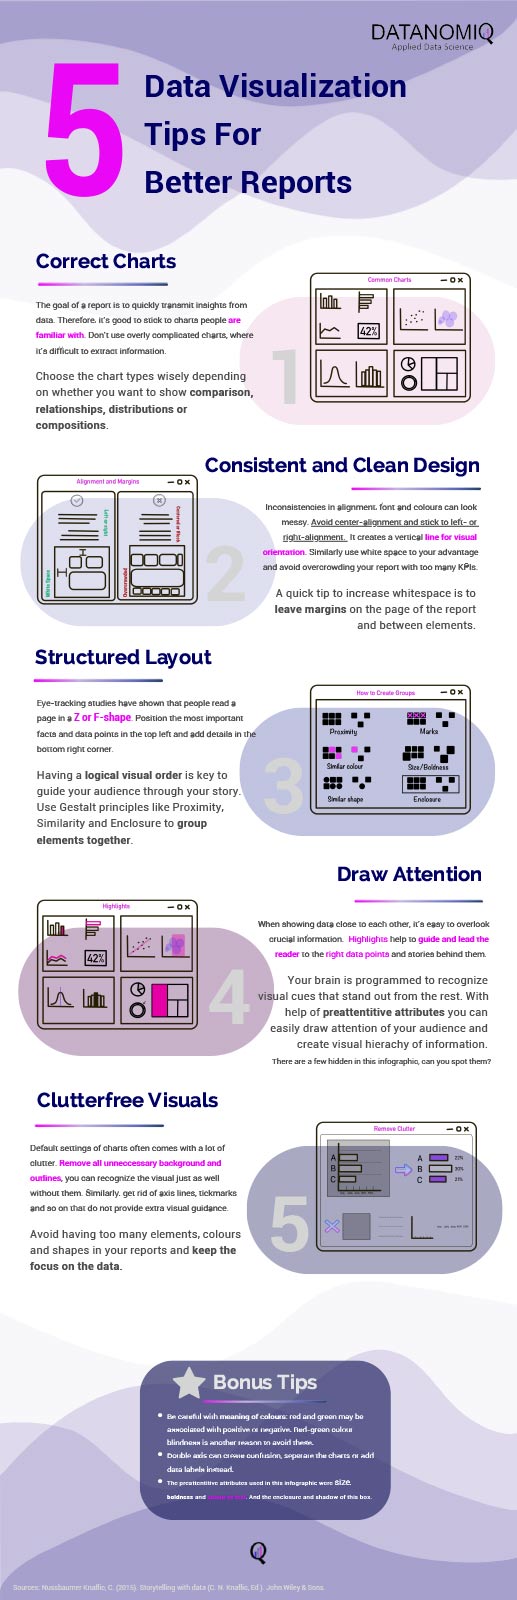
Based on our experience and the book “Storytelling with data”, we have created an infographic that conveys five tips for better design of BI reports – with self-reflective clarification.